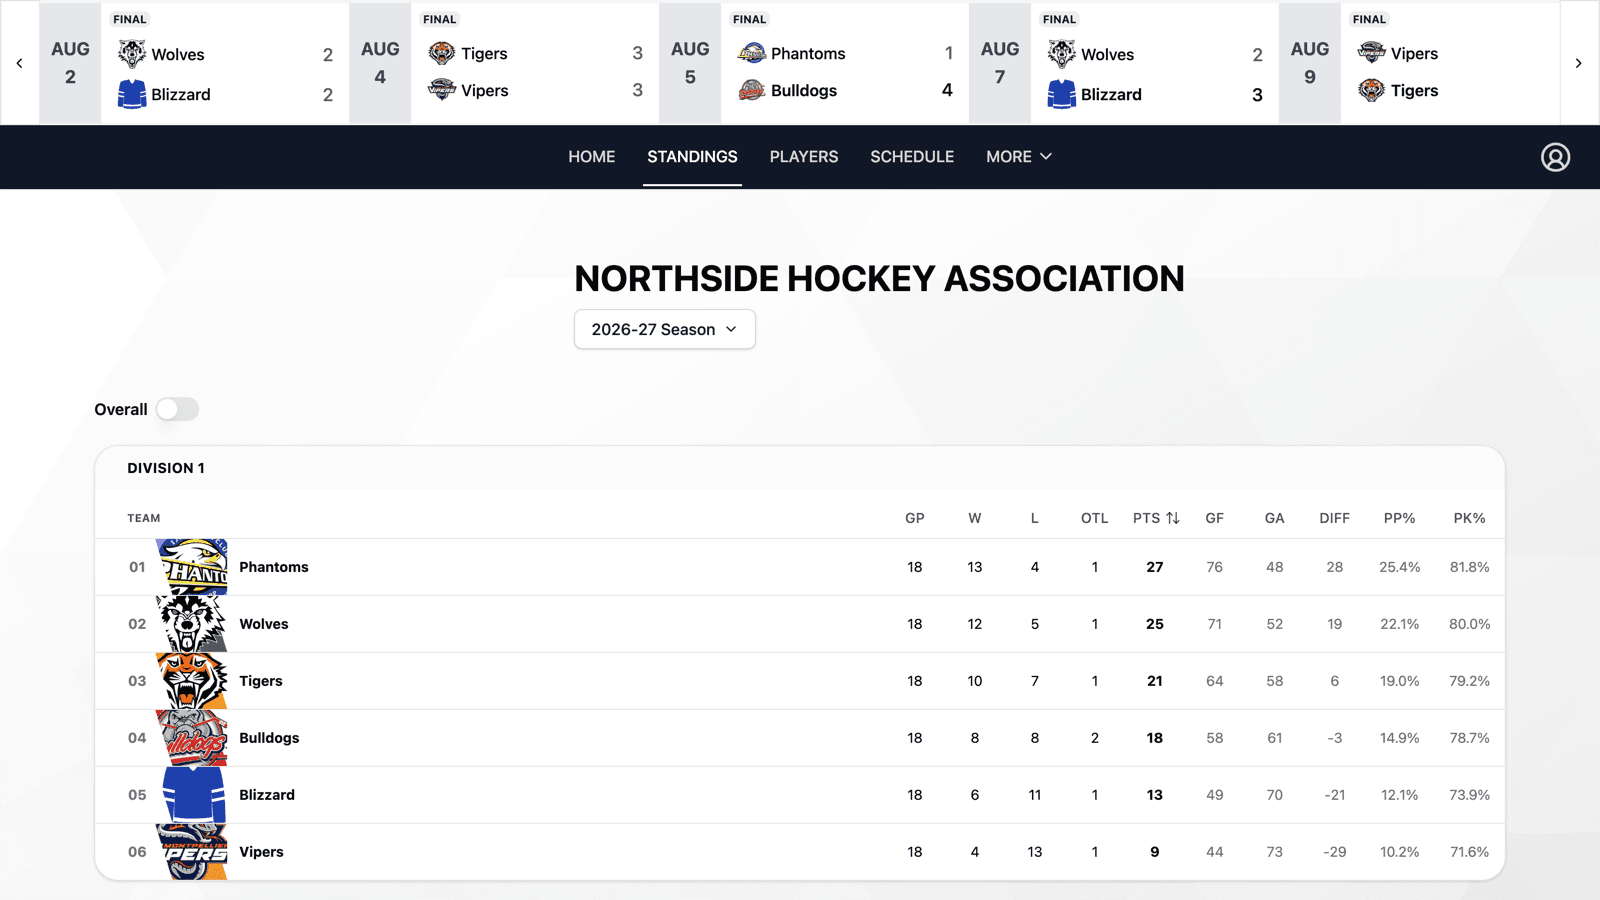
Ask any coach what decided a close game and you'll hear the same answer more often than not: special teams. Yet in most beer leagues, junior circuits, and adult rec associations, nobody actually knows their power play percentage—because counting it by hand means going back through every gamesheet of the season. Starting today, HockeySync counts it for you.
We're introducing Special Teams Tracking: automatic power play and penalty kill accounting for every team in your league. Power play goals, power play opportunities, goals allowed while shorthanded, and times shorthanded are now stored on each team's season record, and PP% / PK% can be displayed right in your standings.
You Don't Enter Anything New
This is the part that matters most: there is no new data entry. Your scorekeeper already logs penalties with a team, a period, a time, and a length, and already tags goals as even strength, power play, or shorthanded. Special teams numbers are derived from exactly those events.
The moment a game is saved, HockeySync reads the game's event list and works out what happened:
- Every penalty that creates a man advantage becomes one power play opportunity for the opposing team, and one time shorthanded for the penalized team.
- A goal tagged as a power play goal converts that opportunity.
- An opportunity that produces no power play goal is an unsuccessful power play—which is the same thing as a successful kill for the other side.
Scorekeepers change nothing about how they work. Leagues that have been scoring games in HockeySync all along simply start seeing special teams numbers appear.
The Details That Usually Get Counted Wrong
Special teams math is easy to get roughly right and surprisingly easy to get exactly wrong. A few rules are built in so the numbers hold up:
Coincidental Penalties Don't Create a Power Play
When both teams take a penalty at the same stoppage, nobody goes on the power play. HockeySync detects those pairs—opposite teams, same period, same length, entered within a few seconds of each other—and offsets them, so a scrum after the whistle doesn't inflate anyone's opportunity count. When the lengths are unequal, only the difference counts as a real advantage.
Misconducts and Penalty Shots Are Excluded
A ten-minute misconduct is served by the player while the team stays at full strength, and a penalty shot doesn't put anyone a skater up. Neither creates a power play opportunity, so neither is counted as one.
Percentages Are Never Stored, Only Counts
HockeySync stores goals and opportunities, and computes the percentage at the moment it's displayed. That sounds like a technical detail, but it's the reason the numbers stay correct: percentages can't be added together across games or seasons, while counts can. A team's season PP% is always its season power play goals over its season opportunities—not an average of averages.
No Data Means an Em Dash, Not a Fake Zero
A team with no recorded opportunities shows “—” rather than 0%. “We never scored on the power play” and “we have no data for this” are very different statements, and the standings should never confuse them.
Corrections Recalculate Everything
Gamesheets get fixed after the fact—a penalty was recorded against the wrong team, a goal should have been tagged as a power play goal, a minor was really a double minor. When you make one of those corrections in HockeySync, the special teams figures for that game are recomputed from scratch rather than nudged by a delta.
That's deliberate. Opportunities aren't independent of one another: adding a penalty can offset one that previously counted, and changing a length from two minutes to ten removes an opportunity entirely. Recomputing the whole game is the only way the totals stay honest after an edit.
Turning On the Standings Columns
PP% and PK% are available as optional standings columns, and they're off by default—a ten-team rec league standings table is crowded enough without columns nobody asked for. To turn them on:
- Open your league dashboard and go to the Standings tab.
- Open the standings settings.
- Add Power Play % and Penalty Kill % to your displayed columns.
- Save. The columns appear for everyone viewing your standings.
Both the regular season and the playoffs are tracked separately, so a team's playoff special teams don't get diluted by sixty games of regular season play.
It Shows Up in Game Stories Too
HockeySync's automatically generated game recaps now bring up special teams when the game actually turned on them—a three-for-five night on the power play, or a penalty kill that went a perfect six-for-six. When the data doesn't support a storyline, the recap stays quiet about it instead of padding the article with numbers that don't mean anything.
What About Past Seasons?
Because these figures come from game events rather than manual entry, they can be reconstructed for games that were scored before this feature existed. If your league has been scoring games in HockeySync with penalties and goal types recorded, reach out and we can backfill your history so your special teams numbers go back further than today.
Available Now
Special Teams Tracking is live for every HockeySync league. Score your next game the way you always have, then turn on the PP% and PK% columns and see who's actually been winning the special teams battle all season.
Not using HockeySync yet? Sign up free and get stats your league can act on—without asking anyone to count them.